Charts & Graphs is a powerful data visualization tool that gives you the ability to create a wide variety of charts and graphs with exceptional customizability.
Data displayed on your website needs to be as engaging as possible so site visitors don’t miss out on critical information. Use Charts & Graphs to serve important information to users via an easy to consume and highly interactive data visualization. It's as easy as building or importing a dataset, selecting a data visualization format, and adding a widget to your site.
Key Benefits
A wide variety of charts, including 3D charts
Select the best chart for your data visualization from a wide range of chart types. You can get all the charts you need in one place: bar charts, pie charts, area charts, stacked charts, radial charts, spider web charts, radarcharts, and many more!
Easily create interactive charts from CSV files
An awesome and time-saving feature of Charts & Graphs is the ability to import a CSV file to create beautiful visualizations. Instead of manually entering the data in, simply import a CSV file every time you make changes, andlet Charts & Graphs handle the rest.
Update your charts automatically from a remote URL
One of the most powerful and robust features of Charts & Graphs is the ability to load the chart's data dynamically from a remote URL, such as Google Sheets, Github, or a specified endpoint. The visualizations on your website will automatically refresh and update as you update your remote data source.
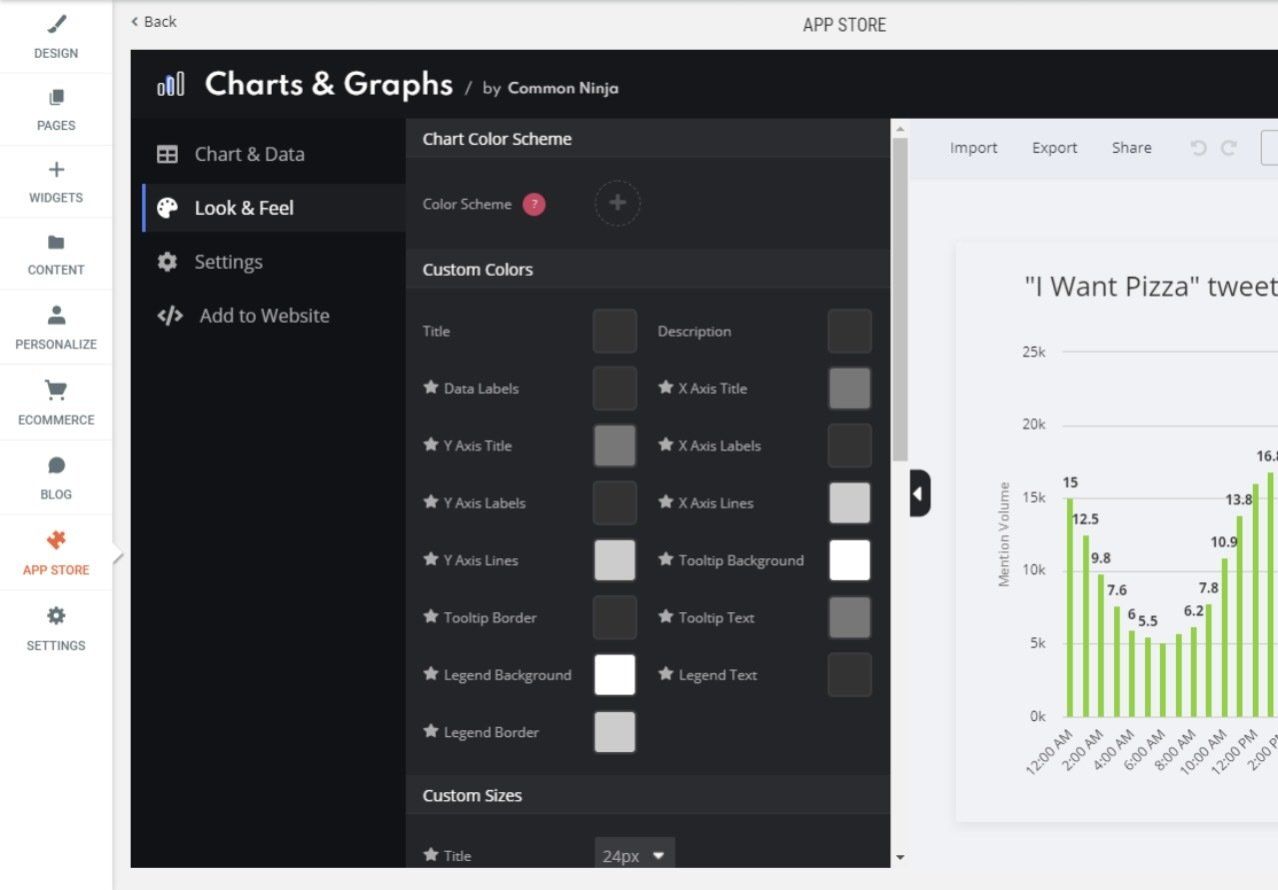
Endless design options
You can customize an extensive set of options to perfectly match the look and feel of your website. You can add a color scheme, edit the axis copy, change the font size, and control the units of numbers.